💵 💴 💶GLOBAL MARKETS💴 💶
Asian markets and the USD paused ahead of the anticipated rate cut in Canada and today’s U.S. inflation data release. The U.S. CPI data will be announced at 16:30 Turkish time. Core inflation in the U.S. is expected to remain at 3.3% in November. The likelihood of a rate cut by the Federal Reserve next week is priced at 85%, while major Wall Street indices have hit record highs.
China’s Breath Against the Dollar’s Strength
On Monday, the dollar lost some value against several currencies after Chinese policymakers announced their intent to “strongly” boost consumption. This news supports the plans of former U.S. President Donald Trump to reverse China’s $300 billion trade surplus with the U.S. This development positively impacted currencies tied to China, such as the Australian dollar and South African rand.
Central Bank Reserves Set New RecordAccording to preliminary data from the Central Bank of the Republic of Turkey (CBRT), total reserves—including gold and gross foreign exchange reserves—have risen to a record high of $159.4 billion.
Technical Overview
DXY
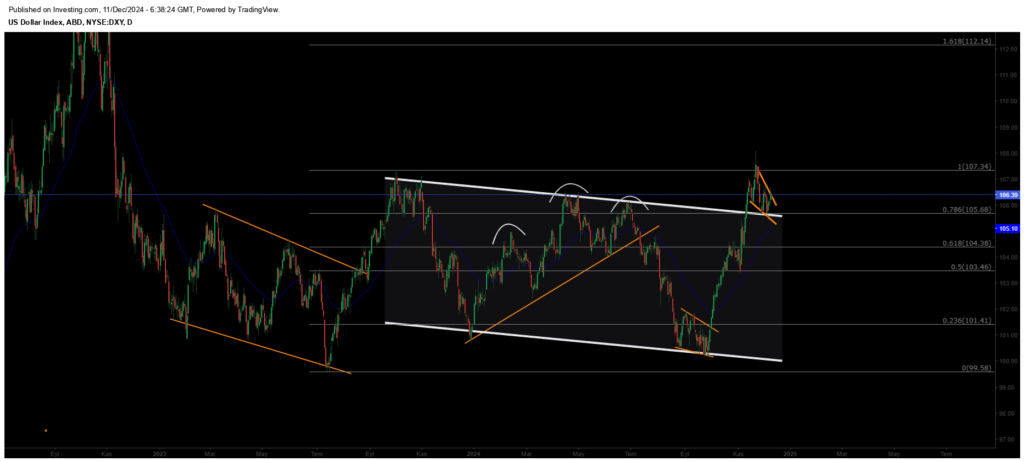
The U.S. Dollar Index (DXY) continues to trade within a descending wedge on the daily chart. Currently priced at 106.39, the index is holding above the 105.68 horizontal support level, suggesting the uptrend may persist for a while longer. If the trend continues, potential resistance levels are 107.34 and 110. A strong breakout above 107.34 could push the index towards 112.
Resistances: 108.00 / 110.00 / 115.76
Supports: 105.68 / 104.38 / 103.46
BTC/USD
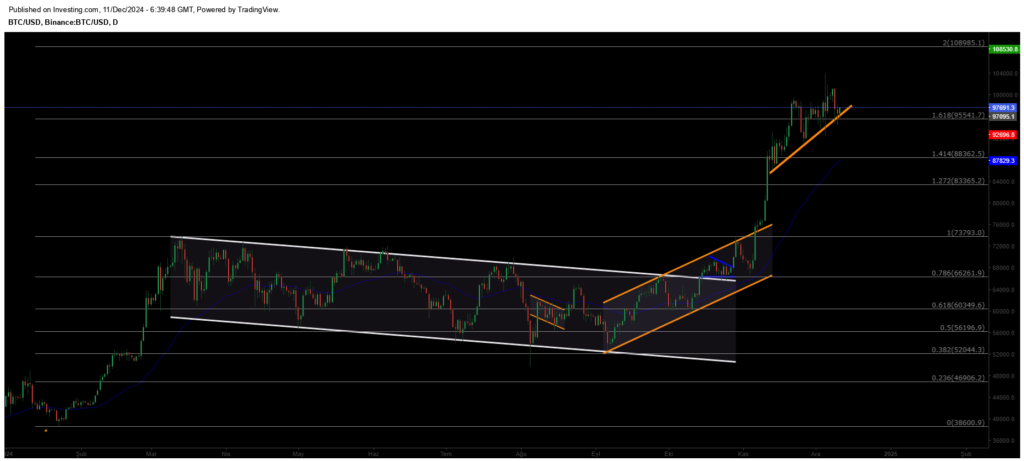
Bitcoin’s uptrend has regained momentum, with the price currently at $97,691. Following recent declines, recovery efforts are ongoing. The key level to watch is $95,540. As long as this support level holds, Bitcoin may continue its climb towards $108,995. However, losing the $95,540 support could trigger a bearish trend, potentially pulling the price down to $88,362.
Resistances: 108,985 / 118,500 / 123,550
Supports: 95,500 / 88,362 / 83,365
ETH/USD
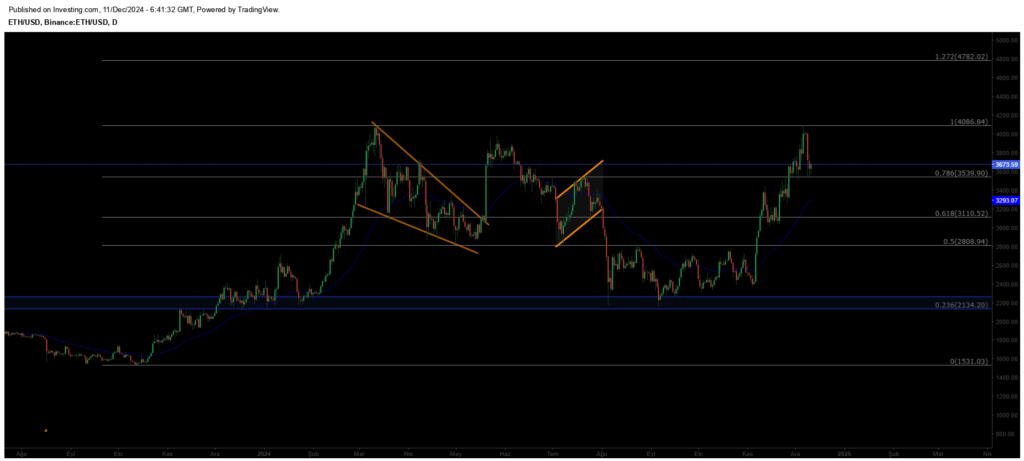
Ethereum has reached its expected target of $4,086 before facing a sharp pullback. It is now trading at $3,673. The critical level to monitor is $3,539, which acts as horizontal support. As long as the price holds above this level, the outlook remains positive. However, if Ethereum closes below $3,539, the price could slide further to $3,110.
Resistances: 4,086 / 4,782 / 5,144
Supports: 3,539 / 3,110 / 2,808
NASDAQ
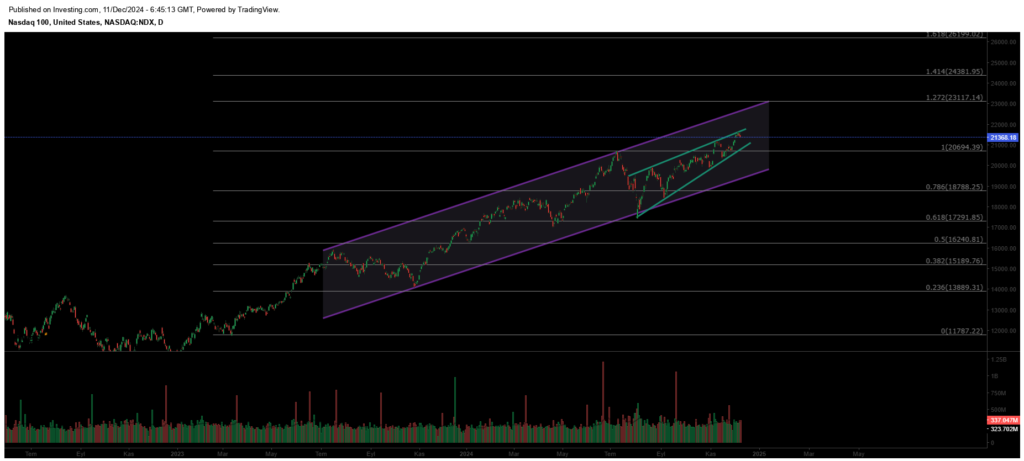
The Nasdaq index continues its uptrend within a rising channel on the weekly chart. However, a wedge formation within the channel has rejected the price at the resistance level, with the index currently trading at 21,368. If the 21,700 level is surpassed and maintained, the index could break the main channel resistance and extend its rally to 22,500. On the downside, breaking below the critical 20,695 support may invite selling pressure, potentially pulling the index down to 20,000.
Resistances: 23,117 / 24,380 / 26,200
Supports: 20,694 / 18,788 / 17,291
BRENT
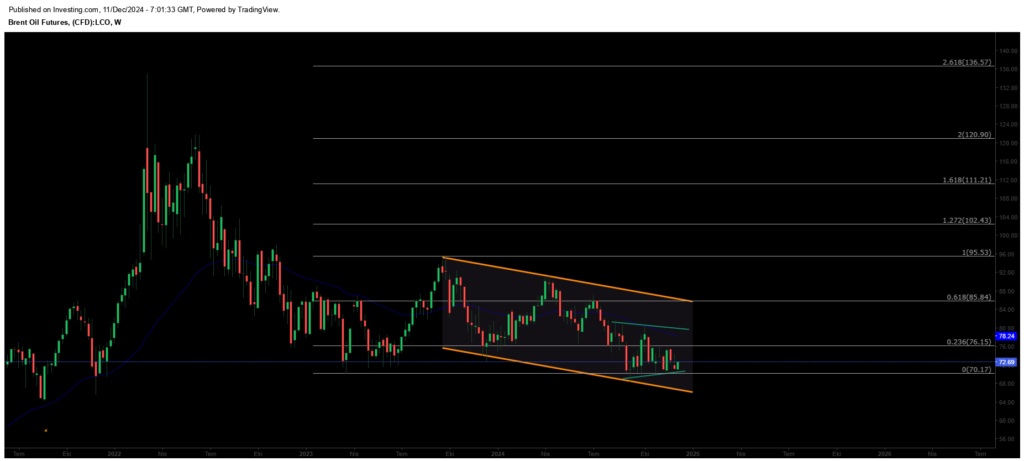
Brent crude has shown mid-term recovery, regaining its previously lost channel structure. Having surpassed the 76.98 resistance level, the price is likely to rise towards the 80.00–82.00 range if it maintains this level. Key support stands at 72.37, where buyers are expected to step in to sustain the trend.
Resistances: 76.15 / 85.84 / 95.53
Supports: 70.17 / 69.00 / 67.80
EURUSD
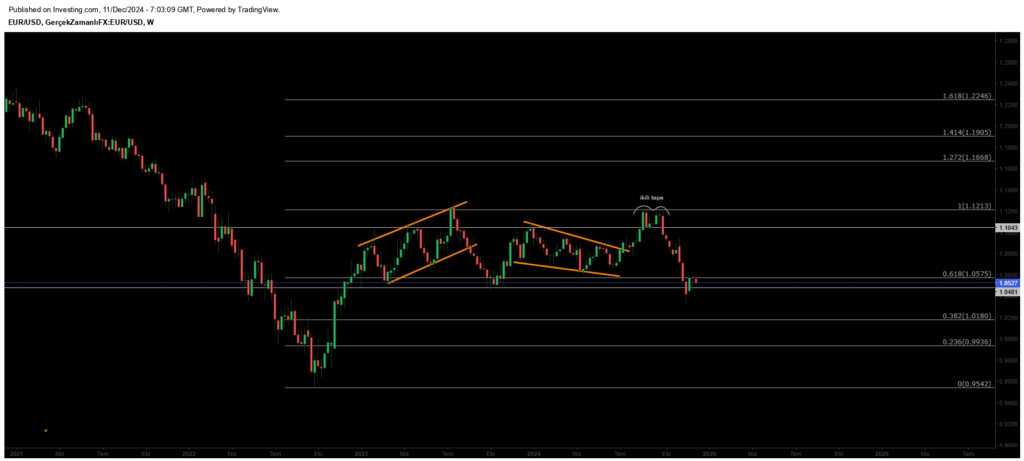
The Euro formed a double top at 1.11 and entered a downtrend. Losing the 1.10 support led to a pullback to the lower channel boundary at 1.07. After breaking the rising support level, the Euro slid to 1.046. At this critical support level, buyers are likely to re-enter the market. However, if the support is broken, the Euro may face deeper declines, potentially reaching 1.099. Price action at these levels will be pivotal in determining the next directional move.
Resistances: 1.0575 / 1.1043 / 1.1213
Supports: 1.0180 / 0.9936 / 0.9542
XAUUSD
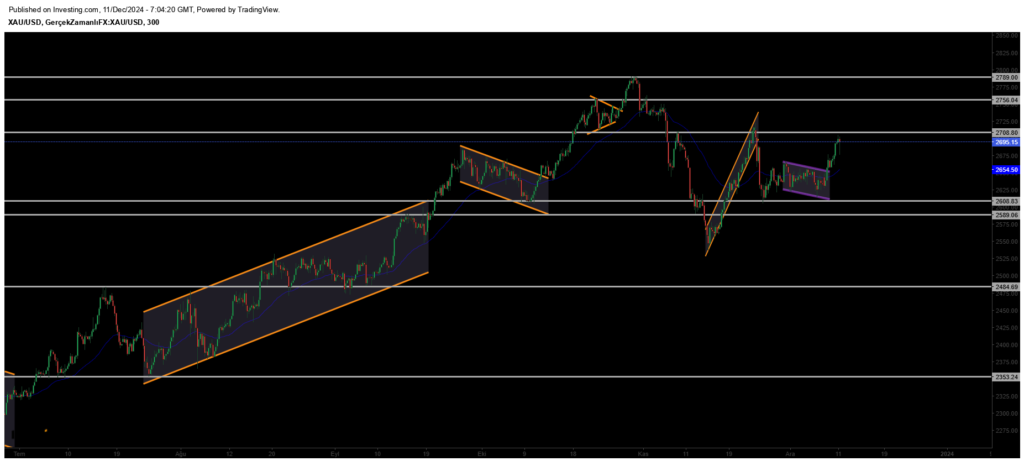
Gold recovered from the 2533 level, reaching its expected target, but encountered strong selling pressure at the rising channel resistance and horizontal resistance zones. Currently trading at 2668, further pullbacks are likely. The 2652 level serves as the key support to watch.
Resistance Levels: 2708 / 2757 / 2790
Support Levels: 2622 / 2590 / 2530


Leave A Comment