💵 💴 💶Bitcoin Surpasses $59,000💵 💴 💶
Bitcoin (BTC) saw a drop of over 4% in the last 24 hours, trading around $58,000 and erasing all gains from the previous week. The decline in BTC has led to losses in major tokens, causing a general market downturn. Ether (ETH) dropped by 3.8%, while Solana (SOL), Cardano (ADA), BNB Chain (BNB), and Ripple each fell by 2.5%. Most of the decline came after the July US Consumer Price Index (CPI) numbers were released. The July CPI rose by 2.9% year-over-year, marking the first time it fell below 3% since 2021. Despite NASDAQ and S&P 500 reversing their losses and ending the day in the green, BTC continued its downward trend following the CPI pressure. According to K33 Research, cryptocurrency prices have been highly sensitive to recent US economic data.
GLOBAL MARKETS
Reflecting the high-risk appetite on Wall Street, Asian markets are set to end the week positively. Japan’s Nikkei index is poised for its best weekly performance in over four years, while the dollar and US Treasury yields remain stable. The recent economic data from the US has eased recession fears in the world’s largest economy. Additionally, the data has weakened expectations for an aggressive rate cut in September, leading to calmer conditions this week.
Critical Data from the UK
Today, the last piece of critical data from the UK this week is being released. Yesterday’s GDP figures showed the economy is on a solid recovery path. Investors are curious if the retail sales data will provide clues about the pace of the Bank of England’s (BOE) rate-cutting cycle. The BOE began cutting rates earlier this month but is maintaining a restrictive policy to combat inflation. Retail sales for July are expected to benefit from sunnier weather.
Technical Overview
DXY
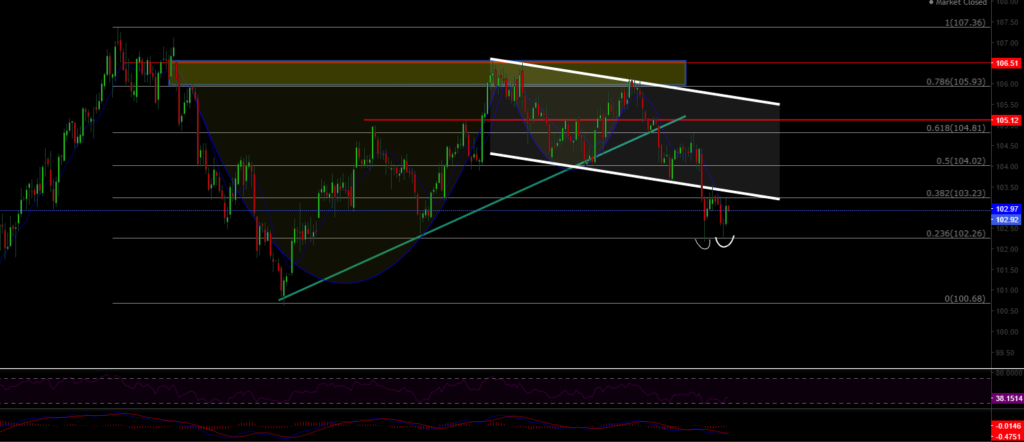
The Dollar Index fell below its current descending channel level and dropped to the expected support level of 102.26. It may rise back into the channel with buying interest from this region. The resistance to watch is at 103.23.
Resistance: 103.23 / 104.02 / 104.81
Support: 102.26 / 100.68 / 100
BTC/USD
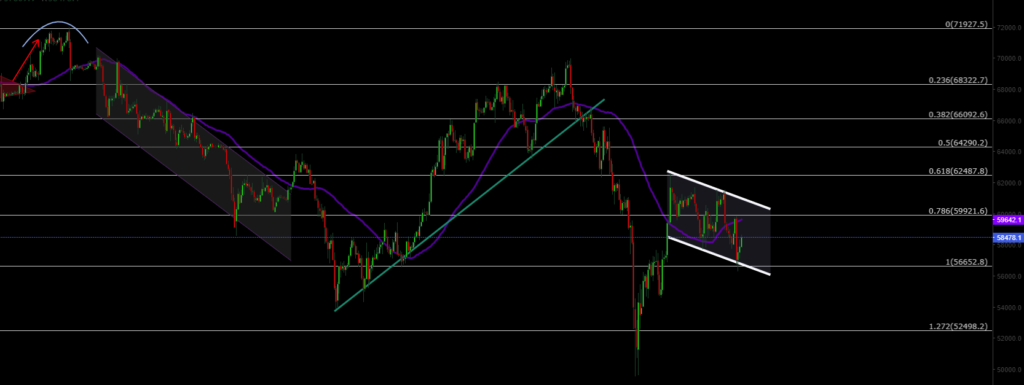
BTC/USD is showing signs of recovery. Currently trading at 58,600, the pair continues to move within its channel. The key support level is 56,650; breaking this could lead to lower levels. However, breaking the channel resistance could drive the price up to 62,400 and 64,300.
Resistance: 60,000 / 62,000 / 64,000
Support: 56,600 / 52,500 / 47,200
ETH/USD
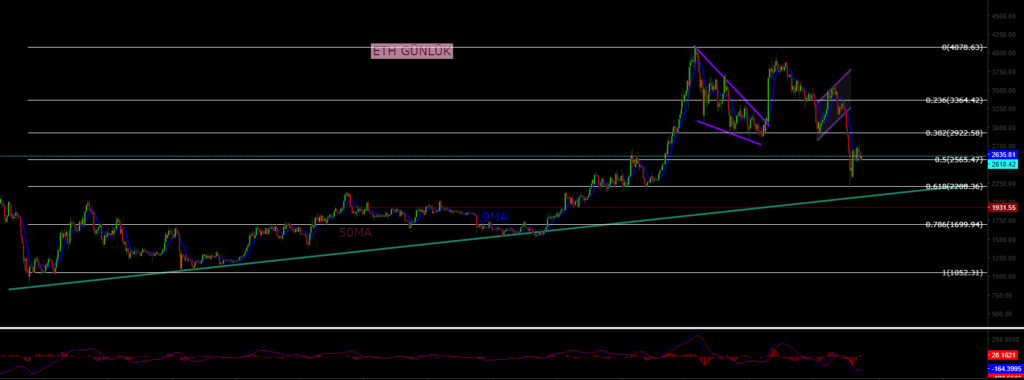
ETH/USD broke its ascending channel structure, continuing potential selling pressure. Currently at a major horizontal support level, ETH/USD needs to break the 2,565 resistance level to turn it into support. Holding above this level could drive the price higher.
Resistance: 3,364 / 4,078 / 4,340
Support: 2,565 / 2,565 / 2,200
NASDAQ
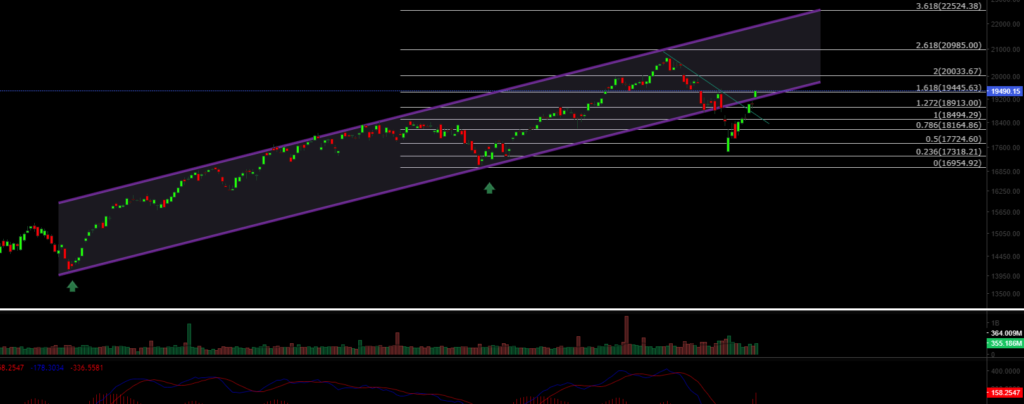
The NASDAQ 100 Index regained its lost ascending channel and is now trading at 19,500. The key support level to watch is 18,913.
Resistance: 19,445 / 20,000 / 20,985
Support: 18,913 / 18,500 / 18,164
BRENT
Brent Crude Oil continues its medium-term uptrend. The support level is at 79.84, which could serve as a buying region in case of a pullback. A significant break above the resistance level of 82.15 could push oil up to the channel’s upper band at 84.50.
Resistance: 82.15 / 84.46 / 87.74
Support: 79.84 / 76.98 / 74.45
EURUSD
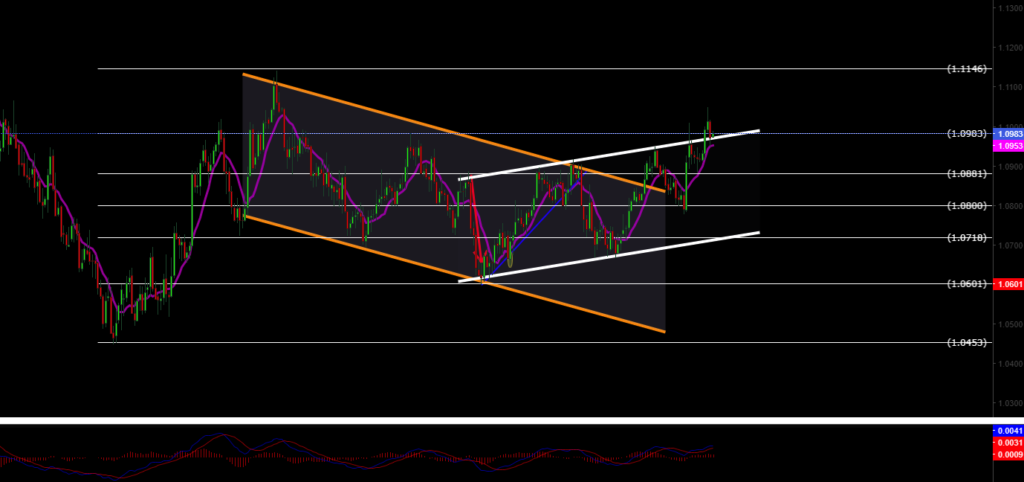
EUR/USD broke its ascending channel resistance and is trading above both horizontal and channel resistances. As long as it remains above the 1.0983 resistance level, the pair could continue its uptrend towards 1.1146.
Resistance: 1.0114 / 1.0120 / 1.0125
Support: 1.0880 / 1.0800 / 1.0710
XAUUSD
XAU/USD broke its descending channel structure with significant volume and is now trading above the 2,433 resistance level. The created ascending channel is seeing a pullback from the resistance level. Key support levels to watch are 2,450 and 2,434.
Resistance: 2,477 / 2,488 / 2,530
Support: 2,450 / 2,400 / 2,373


Leave A Comment