💵 💴 💶Why is Bitcoin (BTC) Price Falling?💵 💴 💶
Bitcoin fell by 3.4% between August 26 and August 27, after dropping below the $63,500 support level it held for two days. This decline is partly due to worsening macroeconomic expectations, as well as decreased activity on the Bitcoin network, which may have led to selling.
Libya Oil Supply Disruption
Following news of a potential halt in oil production in Libya due to political conflicts, oil prices rose again to over $81 per barrel, increasing by more than 3%. The internationally recognized Tripoli-based government wants to replace the current central bank governor. However, the unrecognized eastern Libyan government supports the current governor and is using this as a negotiation tactic, threatening to halt oil production. Since Libya’s oil production is between 1.1-1.2 million barrels per day, this situation is significant for the oil market.
GLOBAL MARKETS
While global stock indices are close to record levels, investors are watching Nvidia’s earnings report, which will be announced today, to gauge risk appetite. In the currency markets, the British pound reached its highest level in two and a half years due to expectations that the UK will lag behind the US in lowering interest rates.
Technical Overview
DXY
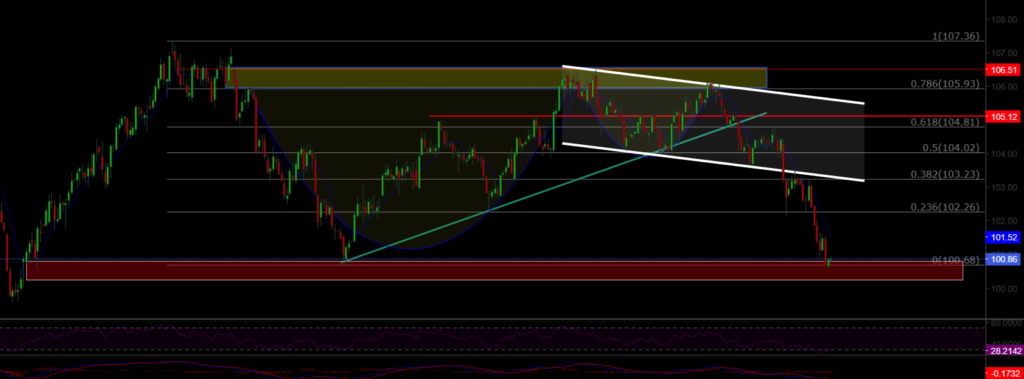
The Dollar Index started the week with a downward trend, falling to the 100.68 support level, which we had anticipated. Having turned the lost channel support into resistance, the downtrend continued. The key support to watch is the 100.68 level. We might see a recovery from this level, but if 100.68 is lost to selling pressure, it could drop to around 98.00.
Resistances: 102.26 / 103.23 / 104.02
Supports: 100.68 / 98.00 / 97.00
BTC/USD
With the recent pullback, BTC/USD has fallen below the $60,000 level. As long as the 56,650 area is not lost, the trend may gain short-term upward momentum. Key resistance levels to watch are 62,487 and 64,290.
Resistances: 62,487 / 64,290 / 66,000
Supports: 60,000 / 56,600 / 52,498

ETH/USD
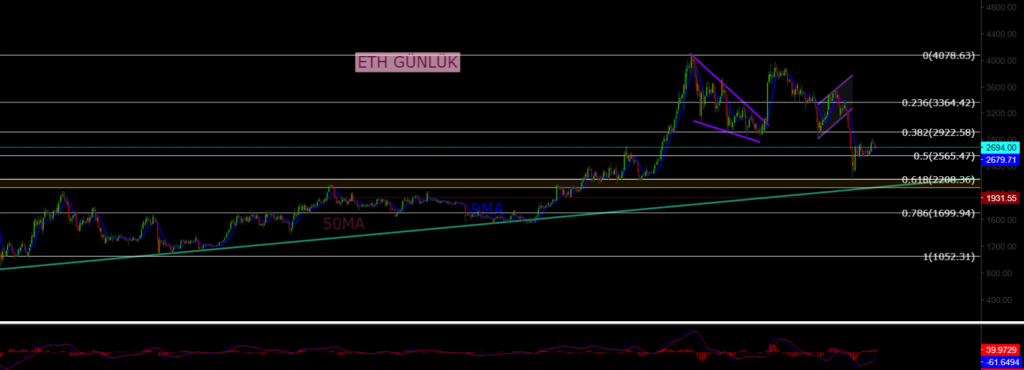
ETH/USD has continued to face potential selling pressure after breaking its rising channel pattern. Currently trading at 2,466, ETH/USD has lost its major horizontal support. The key support and buying zone to watch is the 2,200 level.
Resistances: 2,565 / 3,000 / 3,364
Supports: 2,200 / 1,700 / 1,052
NASDAQ
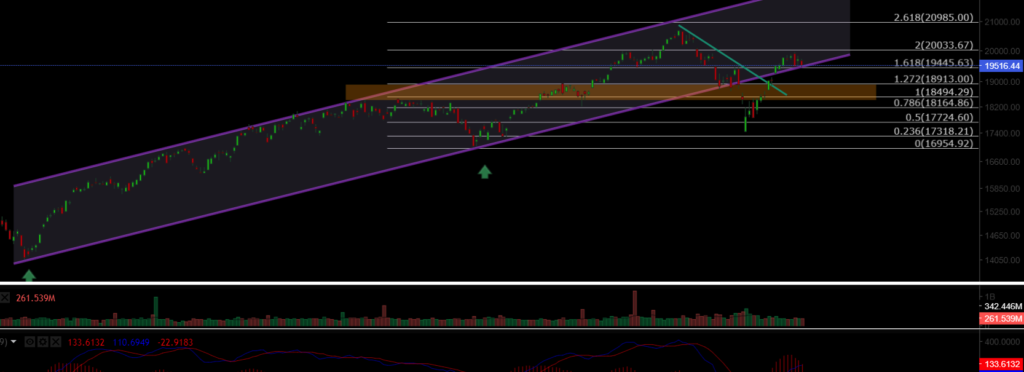
The NASDAQ 100 Index started the week on a positive note. After regaining the lost rising channel, it managed to price at 19,500. The index, having retreated to the channel support, may recover from these levels and continue its upward trend. Volume trends show increasing activity. The key support level to watch is 18,913.
Resistances: 20,000 / 20,985 / 22,250
Supports: 19,445 / 18,913 / 18,500
BRENT
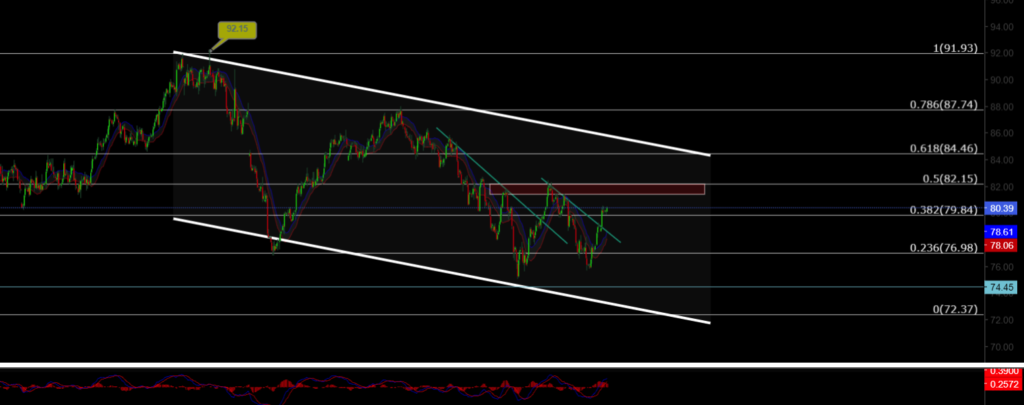
Brent Oil continues its medium-term correction. With signs of recovery, oil is expected to experience volatility with today’s crude oil inventory report. The key support level to watch is 76.98.
Resistances: 79.84 / 82.15 / 84.46
Supports: 76.98 / 74.45 / 72.37
EURUSD
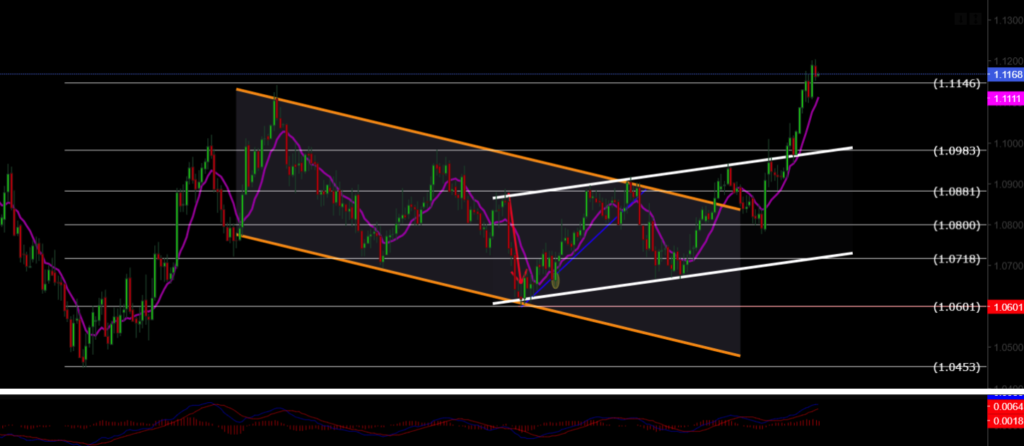
EUR/USD broke its rising channel resistance, managing to trade above both the horizontal resistance and channel resistance. It remained above the 1.0983 resistance level and reached the target resistance level of 1.114. If it continues to trade above the 1.11 resistance level, the next target could be 1.1277.
Resistances: 1.127 / 1.130 / 1.135
Supports: 1.117 / 1.088 / 1.080
XAUUSD
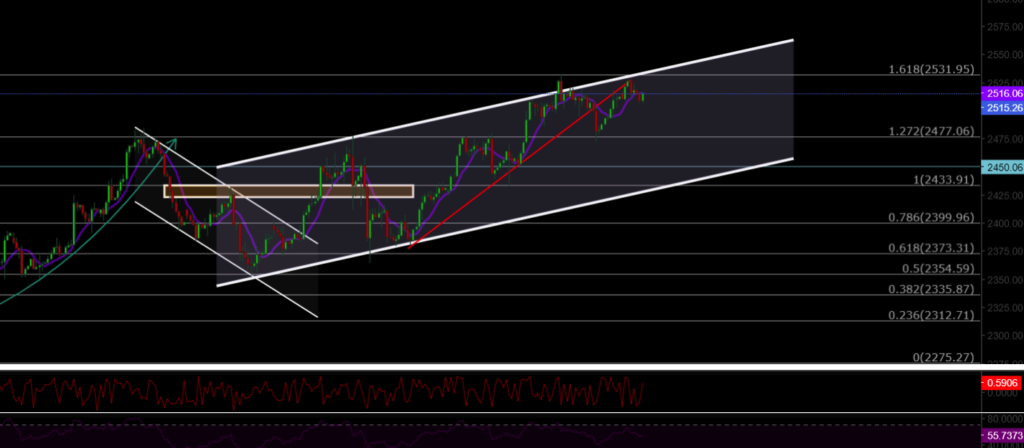
XAU/USD broke its rising channel pattern and reached an ATH level of 2,530. With selling pressure, it re-entered the rising channel pattern and lost the rising channel support. XAU/USD received a reaction rally from the 2,477 support level. The key resistance level to watch is 2,530, and if this level is tested, it could lead to another correction.
Resistances: 2,530 / 2,570 / 2,600
Supports: 2,488 / 2,477 / 2,450


Leave A Comment