💵 💴 💶Short-Term Bitcoin Investors Facing Heavy Losses💵 💴 💶
Short-term investors in the Bitcoin market are facing significant losses, which could increase the likelihood of these investors selling if the market declines further. According to a report by Glassnode, new Bitcoin investors are experiencing unrealized losses on average. This could lead to substantial selling pressure in the event of a market correction. The market is expected to remain weak until the spot price returns to the short-term investors’ cost base of $62,400.
S&P 500 and Dow Decline Ahead of NFP, Nasdaq Rises
The market presented a mixed picture today. The Nasdaq Composite Index (+0.3%) closed slightly higher due to gains in mega-cap stocks, while the S&P 500 fell 0.3% and remained below its 50-day moving average (5,506). The mixed movements in U.S. stocks continued throughout the session, as attention focused on the August Employment Situation Report, which will be released tomorrow. Recent market focus has been on labor market conditions, but the data released this morning did not cause a significant reaction in stocks or bonds.
OPEC+ Possible Delay in Oil Supply Increase
Oil prices continued to decline yesterday. ICE Brent fell more than 1.4% during the day, while NYMEX WTI dropped below $70 per barrel for the first time since December. Despite reports that OPEC+ is considering delaying its planned supply increase in October, weakness in prices persists. It is clear that demand concerns are outweighing the potential delay in supply increases. If these reports are accurate, the next critical question will be how long the group will postpone the supply increases. With an anticipated surplus in the oil balance until 2025 (assuming OPEC+ implements its supply increases), it might make sense for cuts to continue until 2025. The data released by API last night was supportive. U.S. crude oil inventories are estimated to have decreased by 7.4 million barrels last week, with small declines also observed in refined product stocks. Gasoline stocks fell by 300,000 barrels, and distillate stocks decreased by 400,000 barrels. EIA’s weekly data will be released later today, and a similar crude oil figure could represent the largest weekly drop since the end of June.
Technical Overview
DXY
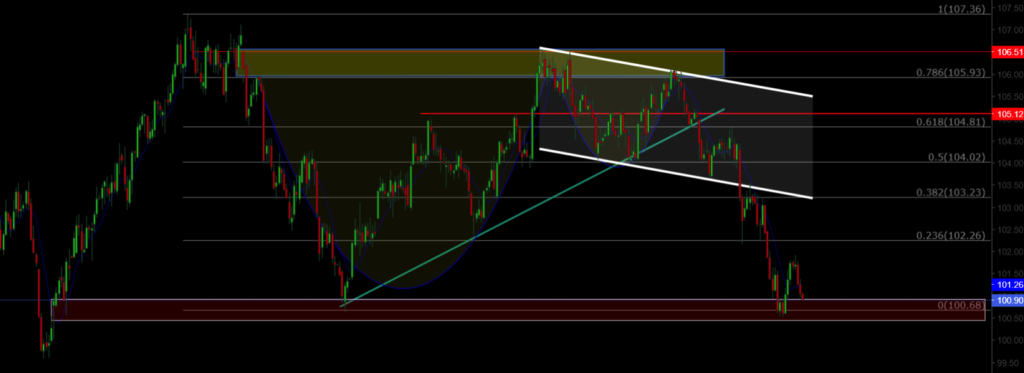
The Dollar Index (DXY) has started the week with a bullish trend and has declined to the expected support level of 100.68, showing signs of recovery. The loss of its channel support has turned it into resistance, continuing the downtrend. The 100.68 level is a critical support; losing this area could pull DXY further down.
Resistance: 102.26 / 103.23 / 104.02
Support: 100.68 / 98.00 / 97.00
BTC/USD
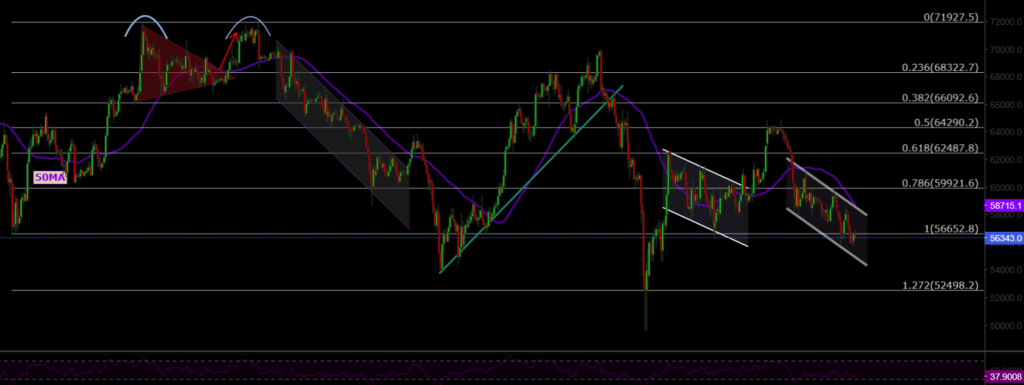
With the recent pullback, BTC/USD has fallen below the 56,600 level. To confirm the start of a short-term upward trend, the price needs to stay above the 60,000 level. Key resistance levels to watch are 60,000 and 62,487.
Resistance: 60,000 / 62,487 / 64,290
Support: 56,600 / 52,498 / 50,000
ETH/USD
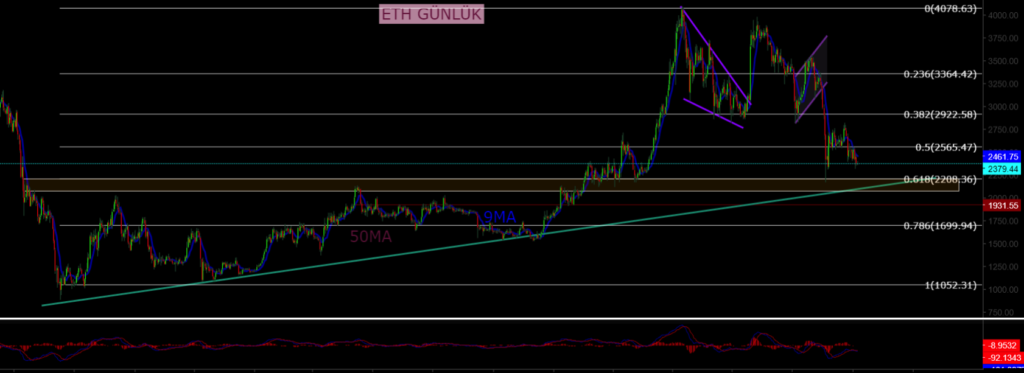
ETH/USD has broken its ascending channel pattern, continuing potential selling pressure. Currently trading around the 2,466 level after losing its major horizontal support, the 2,200 level is an important area to watch for potential buying interest.
Resistance: 2,565 / 3,000 / 3,364
Support: 2,200 / 1,700 / 1,052
NASDAQ
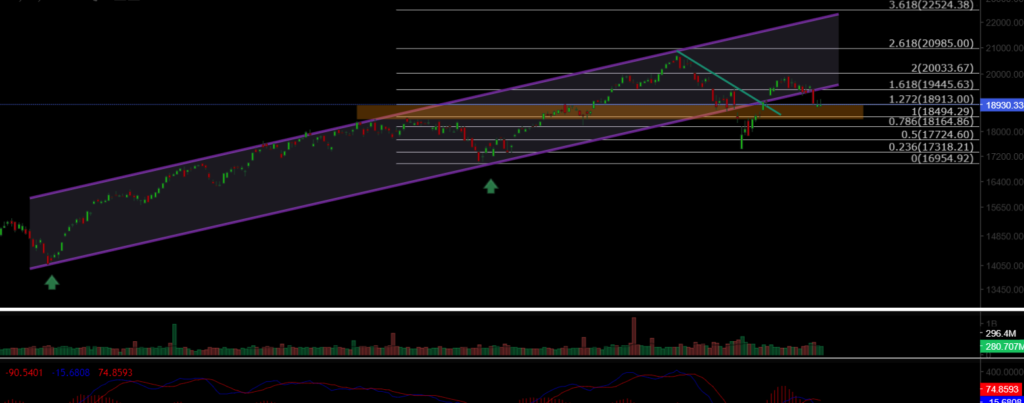
The NASDAQ100 Index started the week with a bearish trend. After falling back to its channel support and losing it, the index has dropped to 18,900. If it loses the 18,490 level, the bearish trend will continue. Key support levels to watch are 18,164 and 17,724.
Resistance: 19,445 / 20,000 / 20,985
Support: 18,913 / 18,500 / 18,164
BRENT
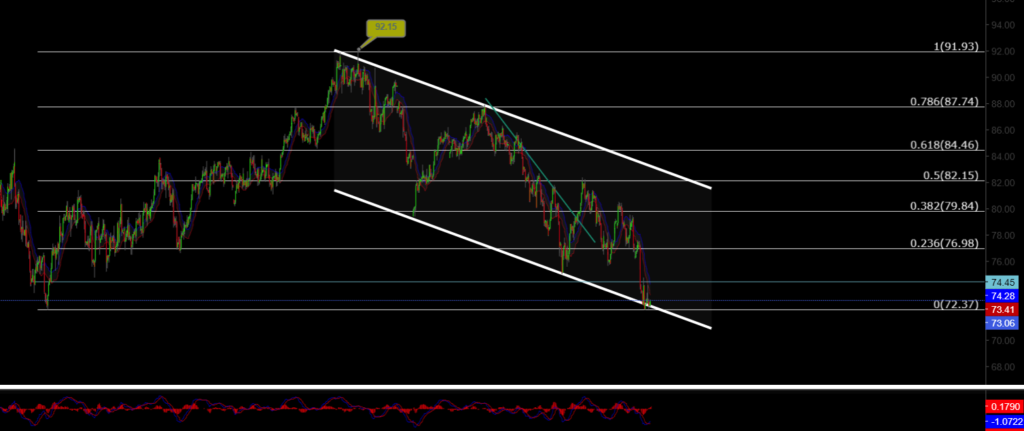
Brent Crude Oil is continuing its medium-term correction. After losing its support level, oil has fallen to the lower support level of the descending channel. There may be a rebound from these levels, but losing the channel’s lower band could lead to new lows.
Resistance: 74.45 / 76.98 / 79.84
Support: 72.37 / 71.00 / 70.50
EURUSD
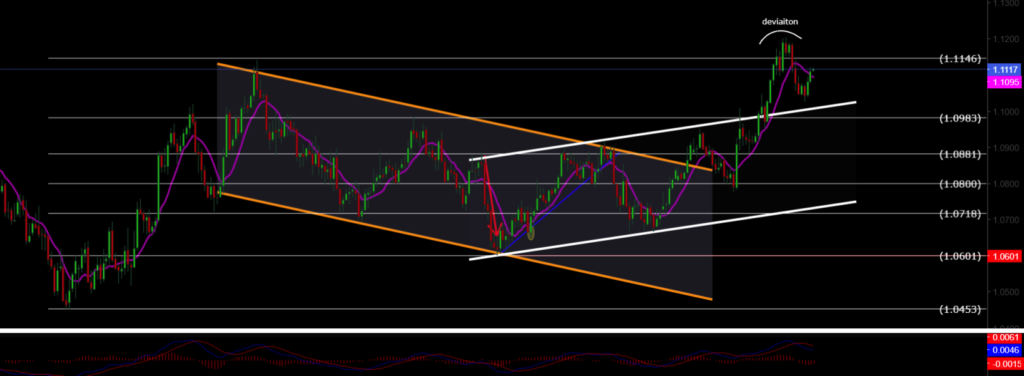
EUR/USD has broken its ascending channel resistance, managing to stay above both horizontal and channel resistance levels. It reached the target resistance level of 1.114 but fell back after losing the 1.11 resistance level. The 1.0983 level is a key support to monitor.
Resistance: 1.127 / 1.130 / 1.135
Support: 1.117 / 1.088 / 1.080
XAUUSD
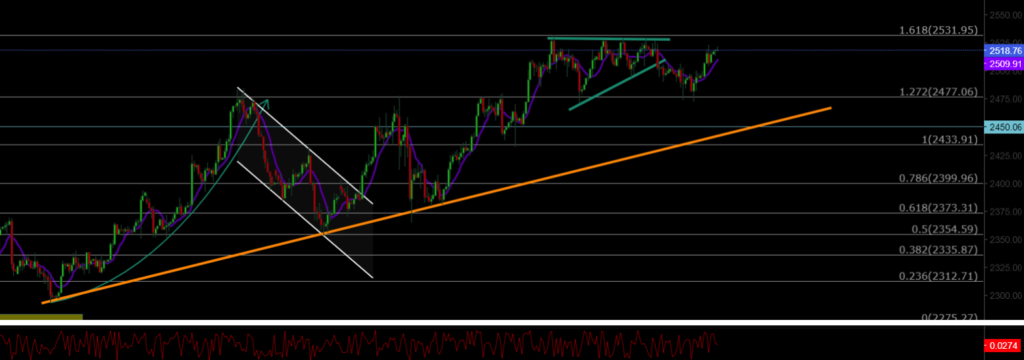
XAU/USD broke out of its descending channel pattern with significant volume, reaching the ATH level of 2,530. With the support of the ascending triangle pattern lost, the price may continue to retreat due to geopolitical risks. The 2,450 level is a key support and potential buying area.
Resistance: 2,530 / 2,570 / 2,600
Support: 2,488 / 2,477 / 2,450


Leave A Comment