💵 💴 💶Bitcoin Reaches New ATH at $75,100 Amid Trump’s Election Victory💵 💴 💶
Bitcoin marked a new all-time high of $75,100 early on Wednesday, marking another historic moment for cryptocurrency. Despite an overall bearish week, positive market signs over the last 24 hours supported this upward move. This latest ATH occurred during the ongoing U.S. elections as investors awaited results. Former President Donald Trump seems to be favored by the American public.
U.S. Dollar: Forex Markets Pricing in Volatility
With a close U.S. election race, results are expected to have a dual effect on currency markets, while FX option markets are trading at a high level of respected volatility. USD/JPY is trading close to 19% weekly volatility, the highest among G10, at levels close to early August when carry trades started to unwind. Weekly high volatility levels are also being matched by typical high-beta currencies such as NOK, AUD, NZD, and SEK. However, comparing implied and realized volatility rates, EUR/USD, USD/CAD, and AUD/USD stand out. For instance, EUR/USD’s weekly volatility is trading at 2.2 times its realized volatility. We find this logical as Trump 2.0 is expected not only to impose tariffs on China but to pursue universal tariffs as well, impacting open economies like the Eurozone and Canada. During Trump’s first term, the Canadian dollar performed strongly as the NAFTA trade agreement was swiftly renegotiated. This time, however, markets appear more concerned about the USMCA agreement — reflected in USD/MXN’s weekly volatility trading at 45%.
GLOBAL MARKETSDespite the ongoing uncertainty around the U.S. presidential election, U.S. stock futures and the dollar surged in Asian trading as investors considered a potential win for Republican Donald Trump. With traditionally Republican-leaning states announcing results first, Trump currently leads over Harris. However, results from swing states, which are expected to be decisive, are anticipated to be announced hours later.
Technical Overview
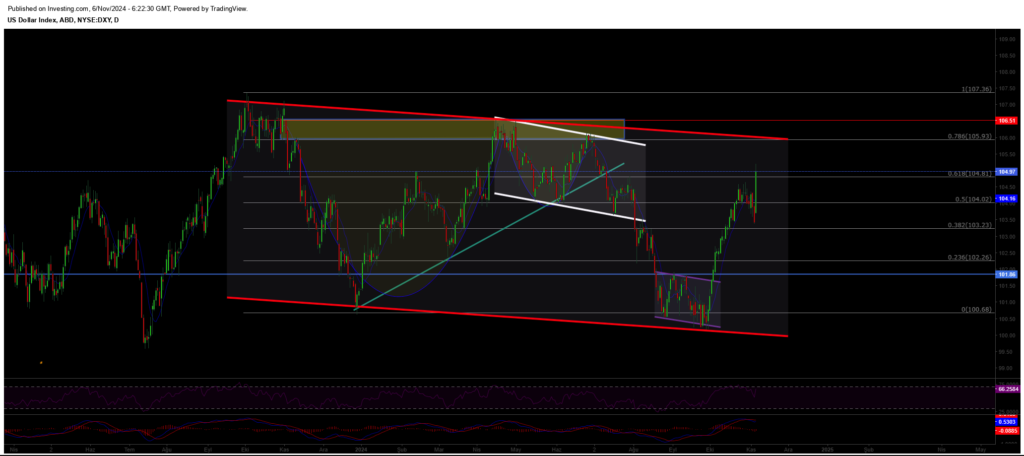
DXY
The Dollar Index (DXY) is strongly recovering at the start of the week, continuing its upward trend. Finding strength at the critical support level of 100.68, the DXY is expected to maintain its upward momentum as long as it stays above this support. Especially as it trades above the 106.68 level, upward movements are anticipated to accelerate. Buyers are observed to be dominant in this area, and the index is likely to advance toward resistance levels.
Resistances: 104.76 / 106.00 / 107.35
Supports: 104.02 / 102.26 / 100.68
BTC/USD
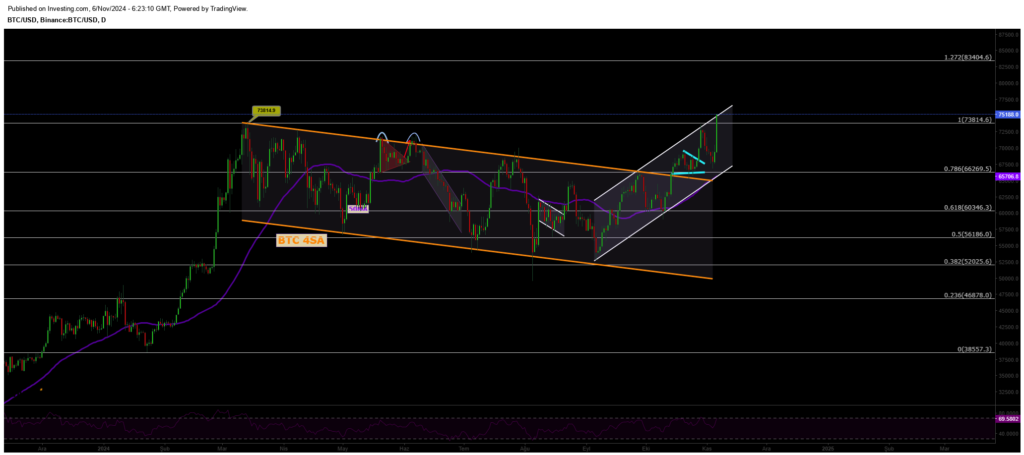
Bitcoin has reached the resistance of the descending channel structure and successfully broke through with significant volume. This resistance zone is crucial for BTC and could open the doors to a new bullish trend in the cryptocurrency markets. If Bitcoin manages to sustain its price above this strategic level, we may see bullish momentum for Bitcoin and other altcoins, triggering a rally that gains traction in the market. Therefore, the current levels represent a critical turning point that should be closely monitored.
Resistances: 68,350 / 71,927 / 75,000
Supports: 66,148 / 64,290 / 60,000
ETH/USD
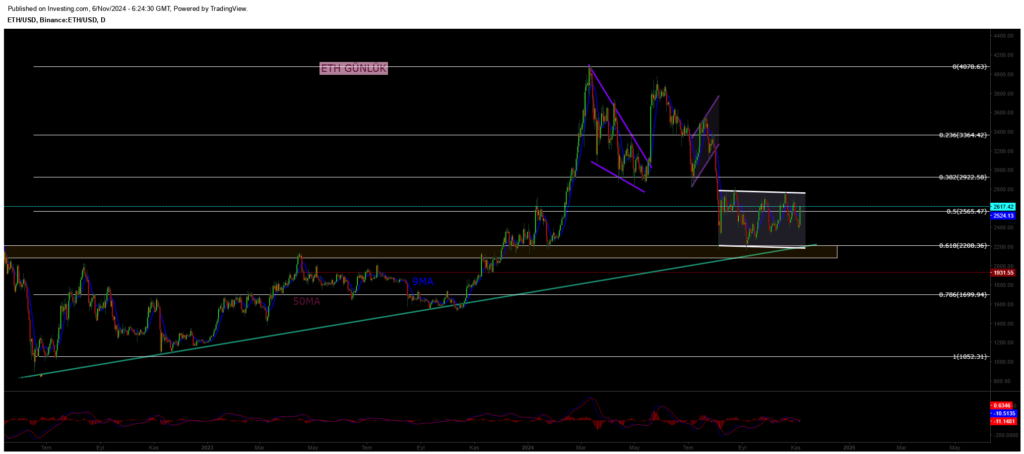
ETHUSD continues to trade within the descending channel pattern, remaining under pressure. After losing its horizontal major support, ETHUSD is now priced around the 2400 level. If selling deepens, the critical support level to watch is 2100, where buyers are expected to strengthen. On the other hand, for the upward trend in ETH to continue, it needs to close decisively above the major resistance at 2922 with strong volume. If this resistance is breached, a new uptrend could begin.
Resistances: 2565 / 3000 / 3364
Supports: 2200 / 1700 / 1052
NASDAQ
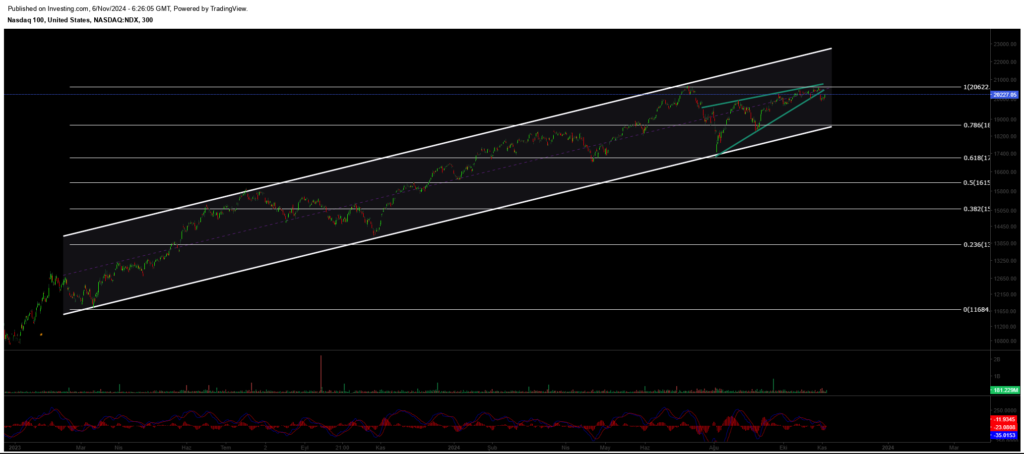
The index, continuing its uptrend, may accelerate its upward movement if it prices above the 20,635 resistance level. Breaking through this level could push the index towards the upper band of the rising channel structure formed since March 2023. In case of a pullback, two key support levels come into focus: in the short term, the 19,600 level is a significant support zone. For a deeper correction, the 18,400 level serves as a strong buying area, where buyers are expected to step in.
Resistances: 20,635 / 22,400 / 23,000
Supports: 18,913 / 18,670 / 17,200
BRENT
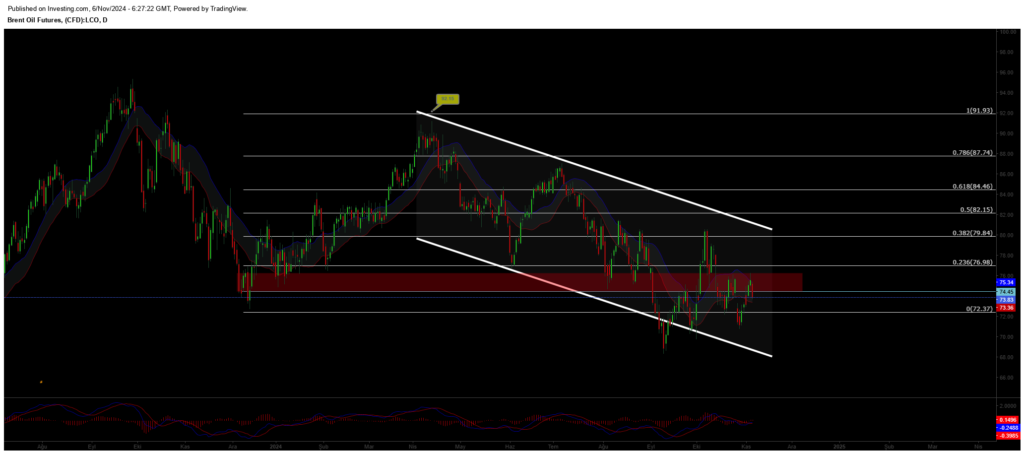
Brent crude has shown medium-term recovery and regained its previous channel structure, continuing its upward trend. It has surpassed the 76.98 resistance zone, and as long as it holds above this level, it is expected to rise towards the 80.00 – 82.00 range. In the event of a pullback, the critical support level to monitor is the 72.37 zone, where buyers are expected to become active. Maintaining this support is crucial for the continuation of the trend.
Resistances: 74.45 / 76.98 / 79.84
Supports: 72.37 / 71.00 / 70.50
EURUSD
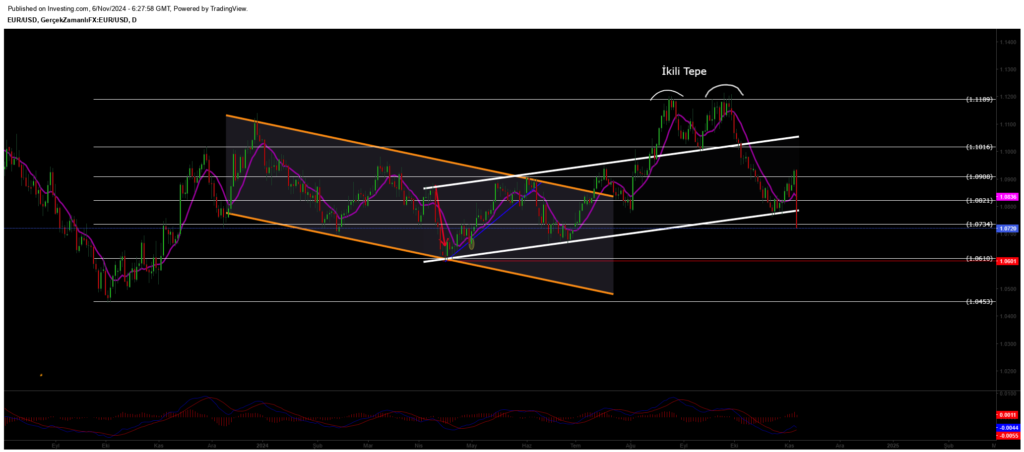
EUR/USD successfully broke through its ascending channel resistance and has been trading above both horizontal and channel resistance. It held above the 1.0983 resistance zone and reached our target of 1.114. However, facing selling pressure around 1.11, it lost this zone, creating a “deviation” and leading to a pullback. Now, the critical support level to watch for EUR/USD is 1.0983. Maintaining this level is crucial for stabilizing the price.
Resistances: 1.114 / 1.130 / 1.135
Supports: 1.098 / 1.088 / 1.080
XAUUSD
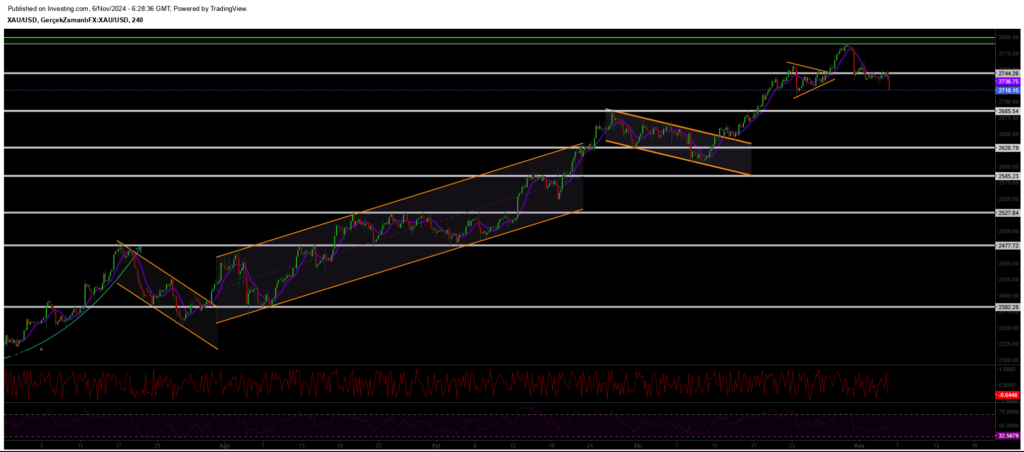
Gold surpassed the 2,742 resistance zone, reaching a new all-time high and heading strongly towards the 2,800 level. In this uptrend, the 2,745 level stands out as a key support; as long as gold stays above this level, it could maintain its upward momentum. As it moves towards the 2,800 target, investors should closely watch whether gold continues to trade above this support zone.
Resistances: 2800 / 2850 / 2910
Supports: 2740 / 2690 / 2625


Leave A Comment