💵 💴 💶Global Markets💴 💶
In global stock markets, cautious trading is observed ahead of the release of U.S. consumer price data later in the day, which could further diminish the likelihood of a rate cut. Investors are also closely monitoring whether corporate earnings reports from banks will meet high expectations. The U.S. consumer price data will be announced at 16:30 (GMT+3). Core inflation is expected to rise by 0.2% in December, but if the data shows an increase of 0.3% or more, equities and bonds may face another wave of sell-offs.
Trump Trade Could Turn into a Trap
The combination of tariffs, tax cuts, and immigration restrictions proposed by Trump has raised consumer inflation expectations. This situation has led bond investors to believe that the Federal Reserve may have already completed its rate-cutting cycle. Persistently high inflation data, rising energy prices, and a strong labor market have also played a role, but Trump’s policies remain a primary factor behind these movements. If Trump fully delivers on his tax cut promises, the resulting increase in Treasury bond supply could deepen uncertainty even further.
A $50 Billion Solution for TikTok by Elon MuskTikTok, one of the most widely used social media platforms in recent years and owned by China-based ByteDance, continues to face scrutiny from U.S. politicians. The U.S. Supreme Court is set to make a final decision by January 19 on whether the app will remain operational in the U.S. According to the Wall Street Journal, Chinese officials are considering allowing Elon Musk to purchase TikTok’s U.S. operations as a solution to the ongoing dispute.
Technical Overview
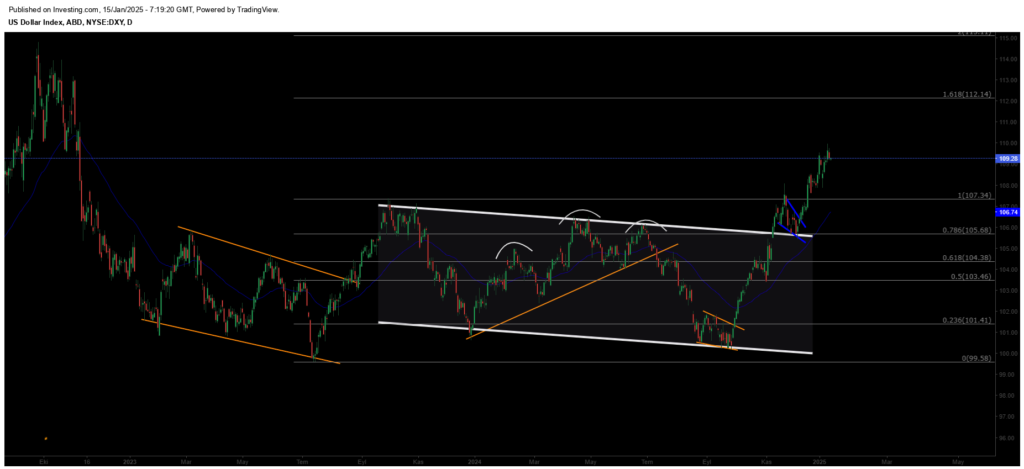
DXY
DXY On the daily chart, the DXY has broken out of a descending wedge structure and appears to be maintaining its upward trend. It is currently trading at the 109.85 level. As long as the horizontal support level of 105.68 is not breached, the upward trend in the DXY is likely to continue for some time. If the trend persists, the potential resistance levels are 112.34 and 115, respectively. Should the price break out at the 112.34 region with significant volume, the uptrend may extend toward the 115 levels.
Resistances: 112.34 / 115.00 / 120.76
Supports: 107.34 / 105.68 / 104.38
BTC/USD
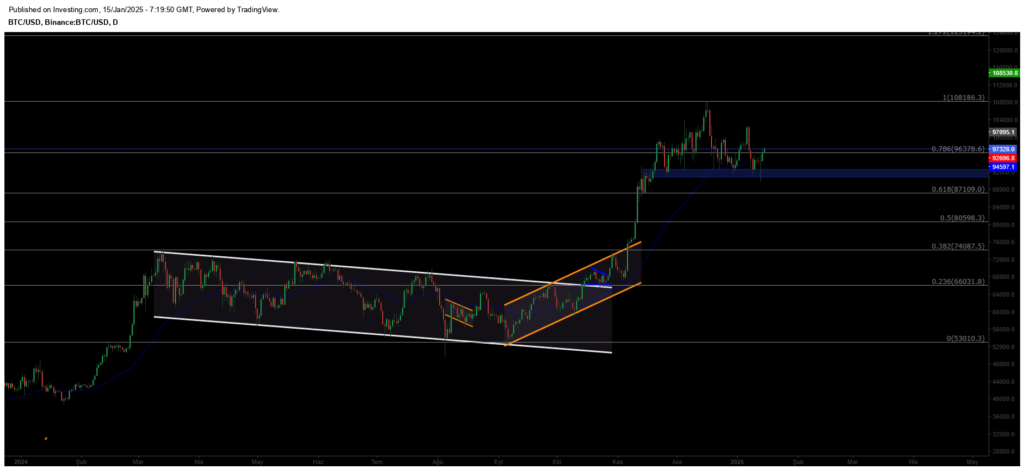
Bitcoin continues its recovery phase, currently maintaining its pricing above the horizontal support level. If this support is lost, Bitcoin’s downward trend is likely to persist for some time, with a price level of $87,100 becoming inevitable. However, as long as the pricing remains above the support level, it is possible for the trend to reverse direction.
Resistance: 108,985 / 118,500 / 123,550
Support: 92,000 / 88,362 / 83,365
ETH/USD
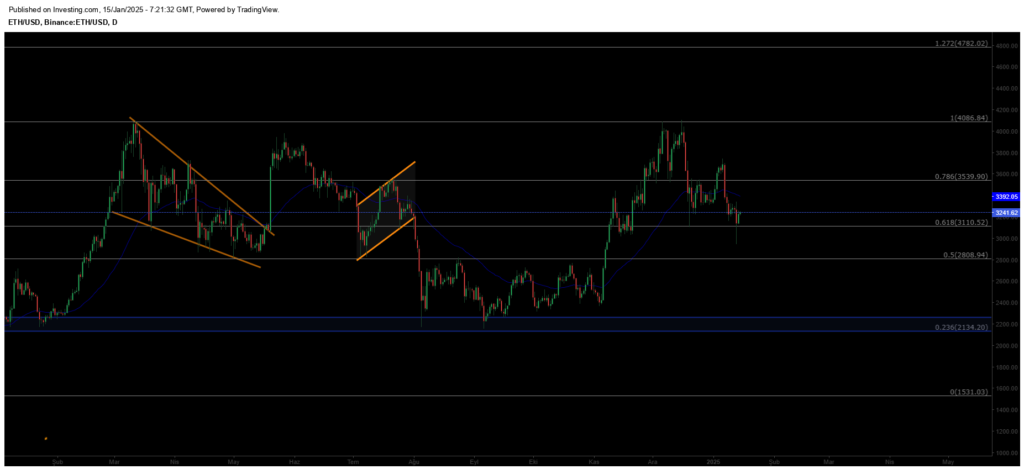
Ethereum has fallen to $2,950 after breaking below the $3,539 support level, entering a downtrend. To see a recovery, Ethereum must close above $3,539, which could trigger a market-wide rebound. The $3,110 level serves as a key support zone to monitor.
Resistance: 3,539 / 4,086 / 4,782
Support: 3,110 / 2,808 / 2,134
NASDAQ
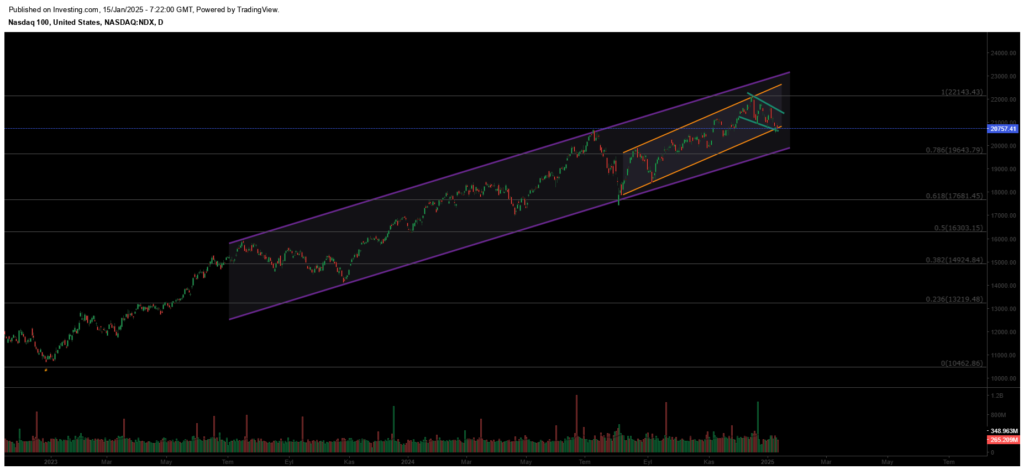
The uptrend in the index continues to strengthen within the ascending channel structure on the weekly charts. In the short term, alongside the descending channel it has formed, a potential breakout above resistance could lead to a short-term uptrend toward the 22,143 level. On pullbacks, the key support level to watch is the 19,643 zone.
Resistances: 22,143 / 25,320 / 26,979
Supports: 19,643 / 17,681 / 16,303
BRENT
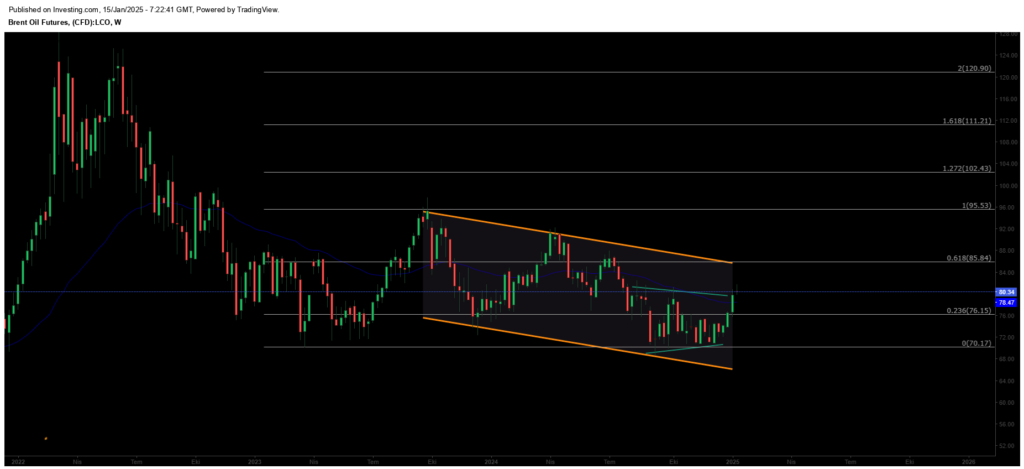
Brent oil shows medium-term recovery and has regained its previous channel structure, maintaining its uptrend. After surpassing the 76.98 resistance, sustained momentum above this level could push prices to the 80.00–82.00 range. The critical support level is at 72.37.
Resistance Levels: 80.00 / 85.84 / 95.53
Support Levels: 76.15 / 70.17 / 69.00
EURUSD
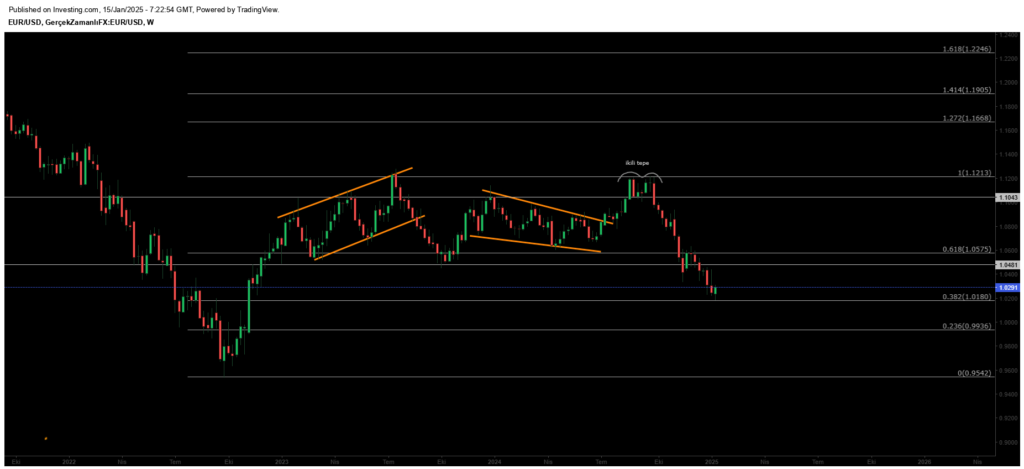
The Euro formed a double top at the 1.11 level and entered a downtrend. After breaking below the 1.10 support, it has retreated to the lower band of its channel at 1.0367. Buyers may step in at this critical support, but a break lower could see further declines to 1.018.
Resistance Levels: 1.0575 / 1.1043 / 1.1213
Support Levels: 1.0180 / 0.9936 / 0.9542
XAUUSD
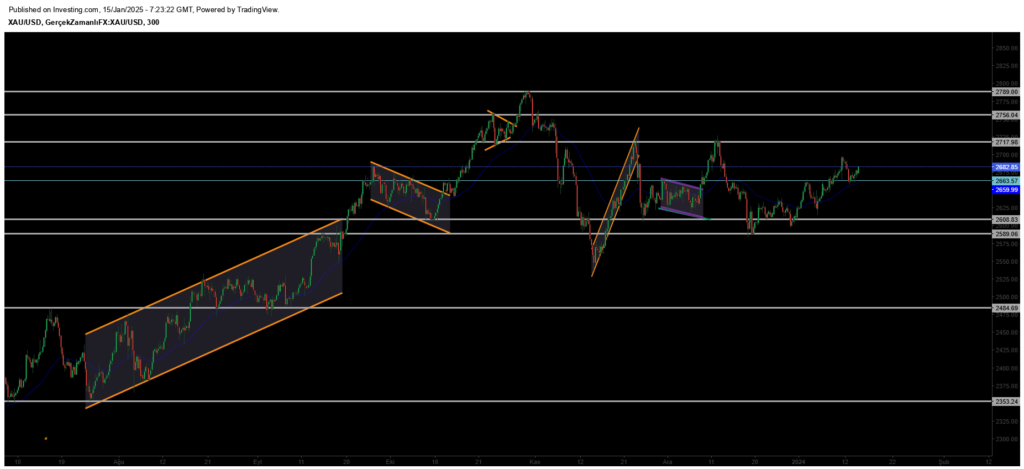
Gold has gained momentum after rebounding from the 2610 support zone, resuming its upward trend. Breaking through the key resistance at the 2666 level with strong volume, it continues its bullish path. However, it may retest the recently broken resistance level. In case of a pullback, 2665 will serve as a key support zone to monitor.
Resistance Levels: 2717 / 2756 / 2790
Support Levels: 2666 / 2589 / 2550


Leave A Comment