💵 💴 💶U.S. Stock Markets Decline Due to Nvidia-Related Losses💵 💴 💶
U.S. stock markets fell due to Nvidia-related losses ahead of key employment data to be released later in the week. These data could be decisive in determining how quickly the U.S. Federal Reserve (Fed) might reduce interest rates. Treasury yields declined following weak data from the U.S. manufacturing sector, while gold prices remained under pressure from a strong dollar. Speculation that Libya might resume oil production and exports led to a sharp drop in oil prices.
U.S. Department of Justice Sends Antitrust Subpoena to Nvidia
The U.S. Department of Justice (DoJ) has sent a subpoena to Nvidia, a leading company in the artificial intelligence (AI) field, as part of its expanding investigation into anti-competitive practices. According to Bloomberg News, which cited sources familiar with the investigation, this move is part of the Department’s efforts to examine whether the company has abused its market dominance.
Oil Prices Decline
In China, the world’s largest oil importer, expectations of a slowdown in economic growth and decreased oil demand have exacerbated the decline in oil prices. Prices fell 5% yesterday, reaching their lowest level since December.
Technical Overview
DXY
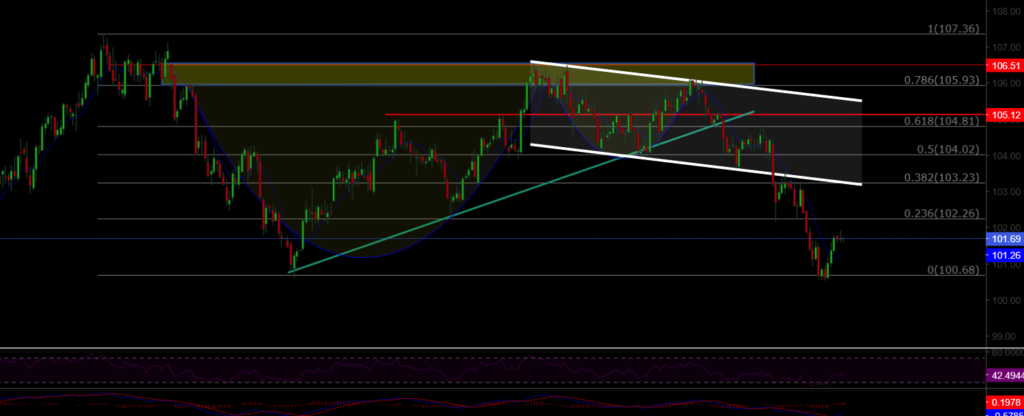
The Dollar Index (DXY) has started the week with a bullish trend and has declined to the expected support level of 100.68, showing signs of recovery. The loss of its channel support has turned it into resistance, continuing the downtrend. The 100.68 level is a critical support; losing this area could pull DXY further down.
Resistance: 102.26 / 103.23 / 104.02
Support: 100.68 / 98.00 / 97.00
BTC/USD
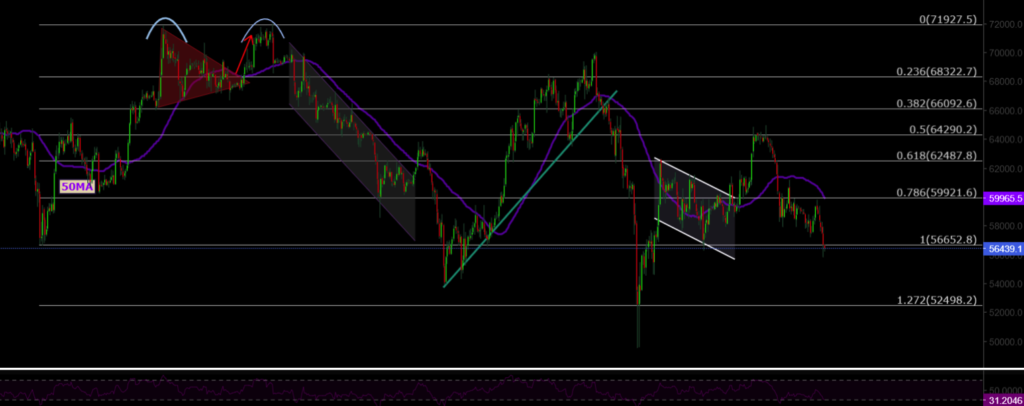
With the recent pullback, BTC/USD has fallen below the 56,600 level. To confirm the start of a short-term upward trend, the price needs to stay above the 60,000 level. Key resistance levels to watch are 60,000 and 62,487.
Resistance: 60,000 / 62,487 / 64,290
Support: 56,600 / 52,498 / 50,000
ETH/USD
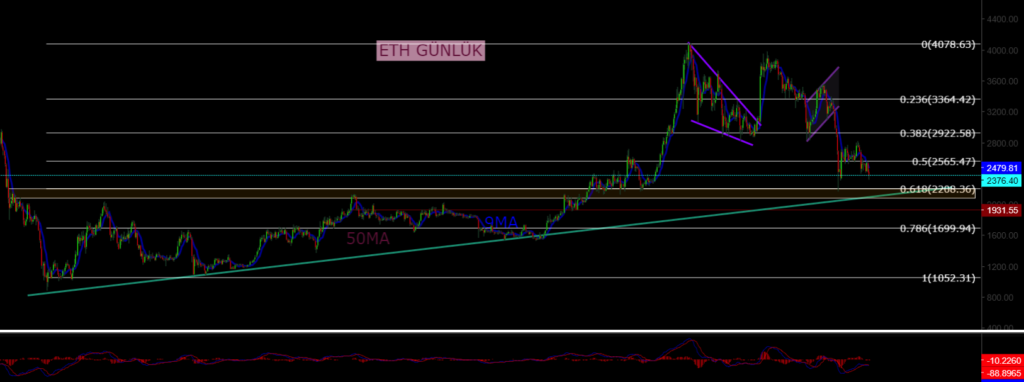
ETH/USD has broken its ascending channel pattern, continuing potential selling pressure. Currently trading around the 2,466 level after losing its major horizontal support, the 2,200 level is an important area to watch for potential buying interest.
Resistance: 2,565 / 3,000 / 3,364
Support: 2,200 / 1,700 / 1,052
NASDAQ
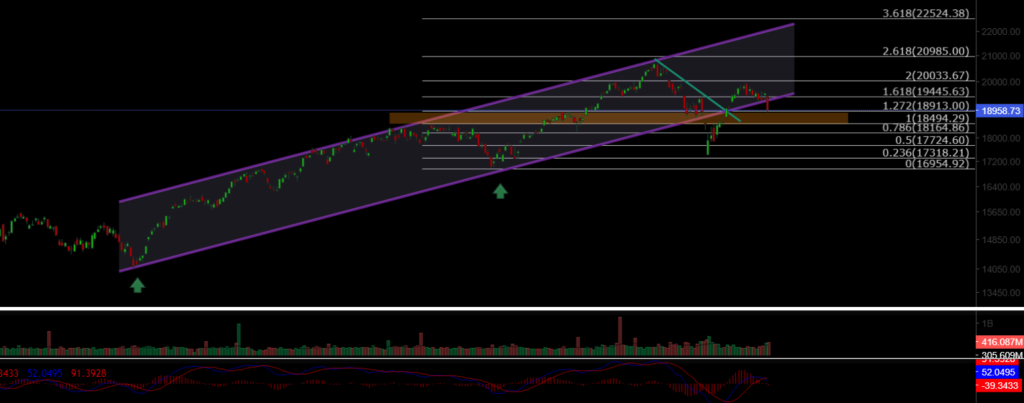
The NASDAQ100 Index started the week with a bearish trend. After falling back to its channel support and losing it, the index has dropped to 18,900. If it loses the 18,490 level, the bearish trend will continue. Key support levels to watch are 18,164 and 17,724.
Resistance: 19,445 / 20,000 / 20,985
Support: 18,913 / 18,500 / 18,164
BRENT
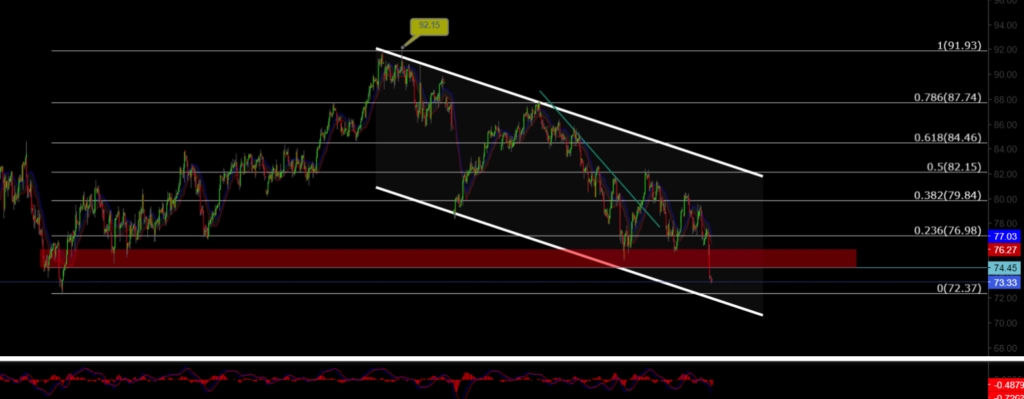
Brent Crude Oil is continuing its medium-term correction. After losing its support level, oil has fallen to the lower support level of the descending channel. There may be a rebound from these levels, but losing the channel’s lower band could lead to new lows.
Resistance: 74.45 / 76.98 / 79.84
Support: 72.37 / 71.00 / 70.50
EURUSD
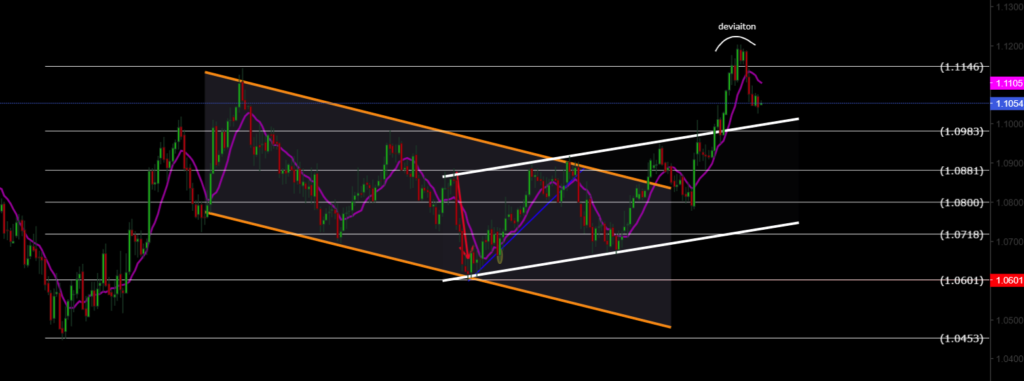
EUR/USD has broken its ascending channel resistance, managing to stay above both horizontal and channel resistance levels. It reached the target resistance level of 1.114 but fell back after losing the 1.11 resistance level. The 1.0983 level is a key support to monitor.
Resistance: 1.127 / 1.130 / 1.135
Support: 1.117 / 1.088 / 1.080
XAUUSD
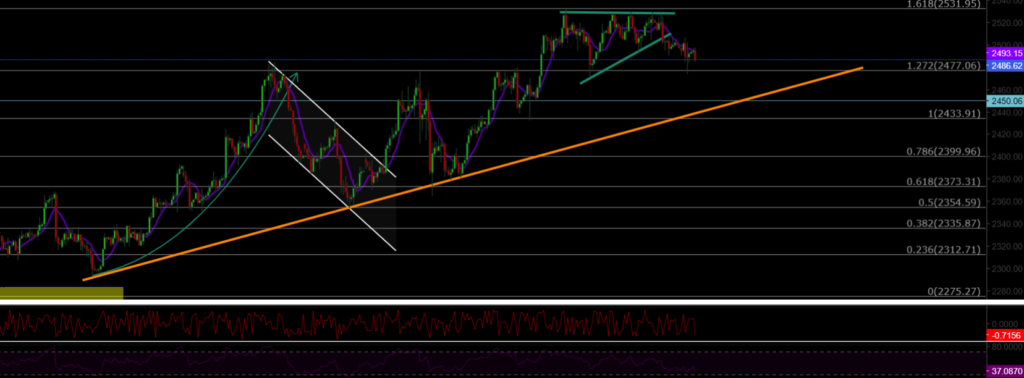
XAU/USD broke out of its descending channel pattern with significant volume, reaching the ATH level of 2,530. With the support of the ascending triangle pattern lost, the price may continue to retreat due to geopolitical risks. The 2,450 level is a key support and potential buying area.
Resistance: 2,530 / 2,570 / 2,600
Support: 2,488 / 2,477 / 2,450


Leave A Comment