💵 💴 💶Peace Talks and Trump Push Commodity Prices Down💴 💶
Oil prices fell yesterday following progress reports on an Israel-Hezbollah agreement. ICE Brent dropped by 3%, trading around $73 per barrel, while NYMEX WTI declined to $69 per barrel. Israel’s ambassador to the US stated that they are “very close to an agreement,” which could be finalized within days once the remaining points are resolved. A Middle East agreement could ease tensions between Israel and Iran, significantly reducing regional supply risks in the short term.
Natural Gas Prices Continue to Rise
Natural gas prices surged this morning due to anticipated cold weather in the U.S. and a stockpile decrease reported last week. The Henry Hub December 2024 contract rose by approximately 9% to $3.39 per MMBtu, while the January 2025 contract increased by 7% to $3.52 per MMBtu.
Escalating geopolitical tensions between Russia and Ukraine have also contributed to the rise in natural gas prices. As the peak winter demand season approaches, this upward trend is expected to strengthen further. Additionally, the U.S. imposed sanctions on Gazprombank last week, a critical intermediary for transferring Russian energy payments from Europe to Russia, further complicating the situation.
Morocco Nears Legalizing CryptocurrenciesMorocco is developing laws to regulate cryptocurrencies, according to the country’s central bank governor. The proposed legislation, still under review, marks a shift from the 2017 cryptocurrency ban. Despite the ban, underground use of digital assets remains widespread.
Technical Overview
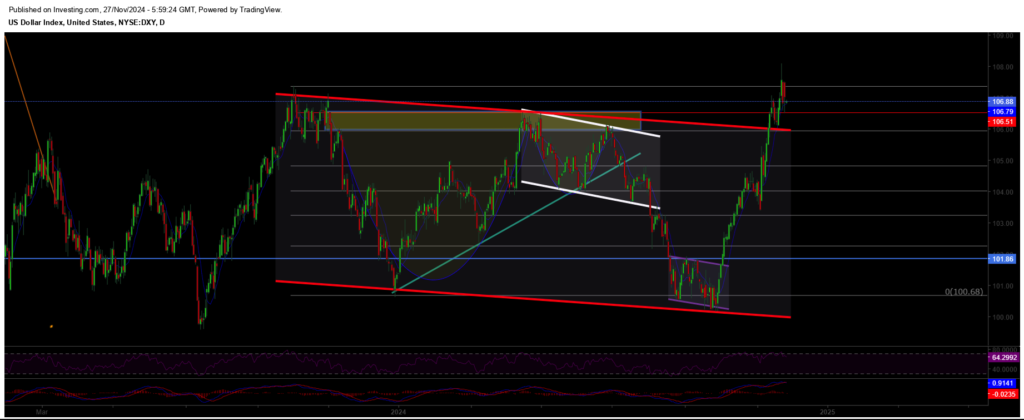
DXY
The Dollar Index (DXY) is strongly recovering at the start of the week, continuing its upward trend. Finding strength at the critical support level of 100.68, the DXY is expected to maintain its upward momentum as long as it stays above this support. Especially as it trades above the 106.68 level, upward movements are anticipated to accelerate. Buyers are observed to be dominant in this area, and the index is likely to advance toward resistance levels.
Resistances: 104.76 / 106.00 / 107.35
Supports: 104.02 / 102.26 / 100.68
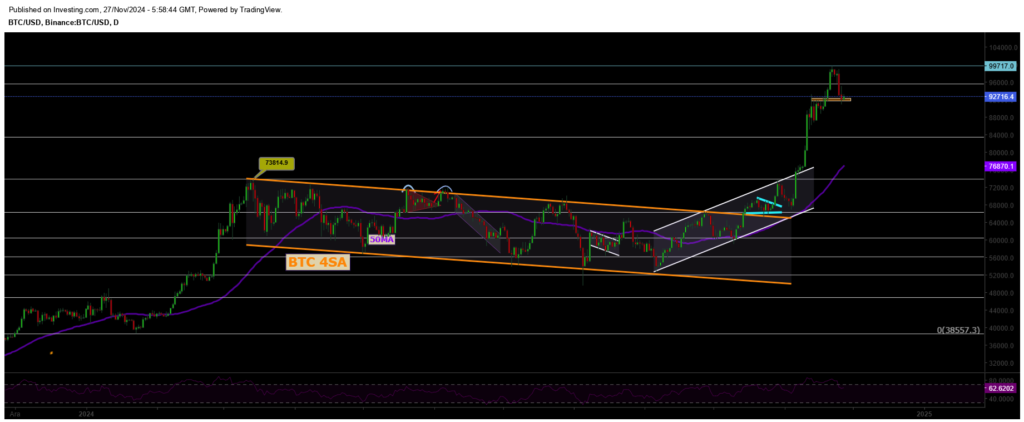
BTC/USD
Bitcoin has reached the resistance of the descending channel structure and successfully broke through with significant volume. This resistance zone is crucial for BTC and could open the doors to a new bullish trend in the cryptocurrency markets. If Bitcoin manages to sustain its price above this strategic level, we may see bullish momentum for Bitcoin and other altcoins, triggering a rally that gains traction in the market. Therefore, the current levels represent a critical turning point that should be closely monitored.
Resistances: 68,350 / 71,927 / 75,000
Supports: 66,148 / 64,290 / 60,000
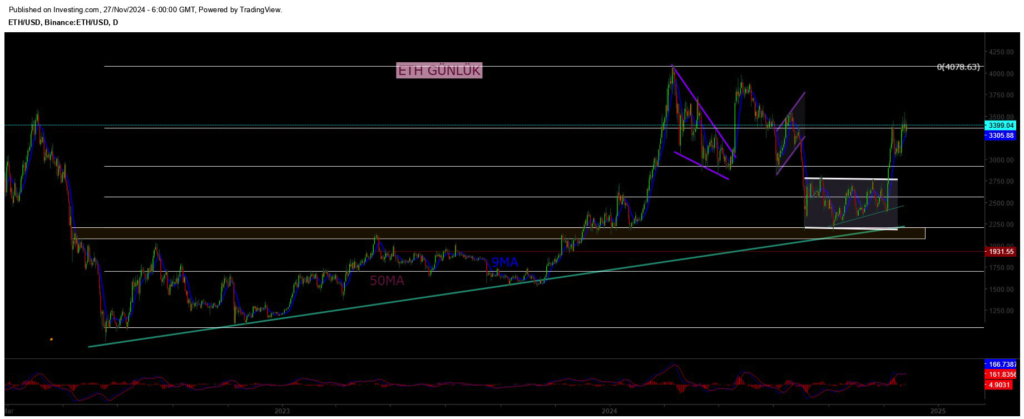
ETH/USD
ETHUSD continues to trade within the descending channel pattern, remaining under pressure. After losing its horizontal major support, ETHUSD is now priced around the 2400 level. If selling deepens, the critical support level to watch is 2100, where buyers are expected to strengthen. On the other hand, for the upward trend in ETH to continue, it needs to close decisively above the major resistance at 2922 with strong volume. If this resistance is breached, a new uptrend could begin.
Resistances: 2565 / 3000 / 3364
Supports: 2200 / 1700 / 1052
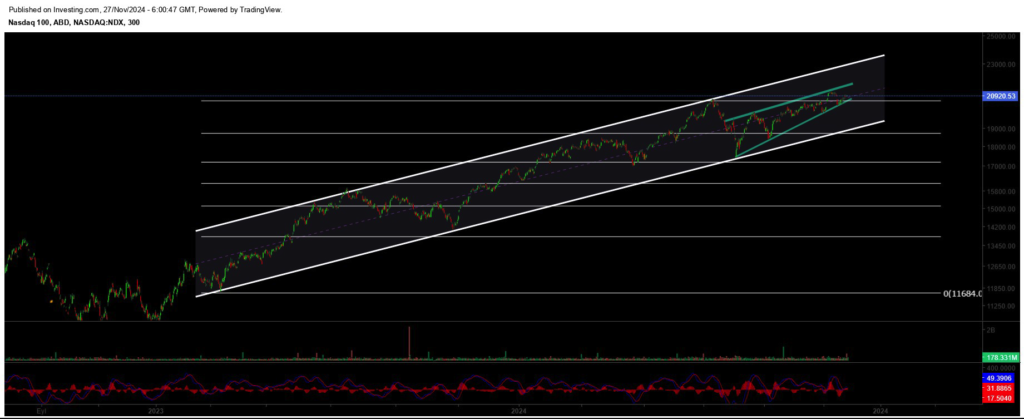
NASDAQ
The index, continuing its upward trend, is pricing above the 20,635 resistance level, maintaining its bullish momentum. In the event of potential pullbacks, two critical support levels stand out. Firstly, the 19,600 level serves as an important support zone in the short term. In case of a deeper pullback, the 18,400 level should be monitored as a strong buying area. Buyers are expected to step in at these levels.
Resistances: 20,635 / 22,400 / 23,000
Supports: 18,913 / 18,670 / 17,200
BRENT
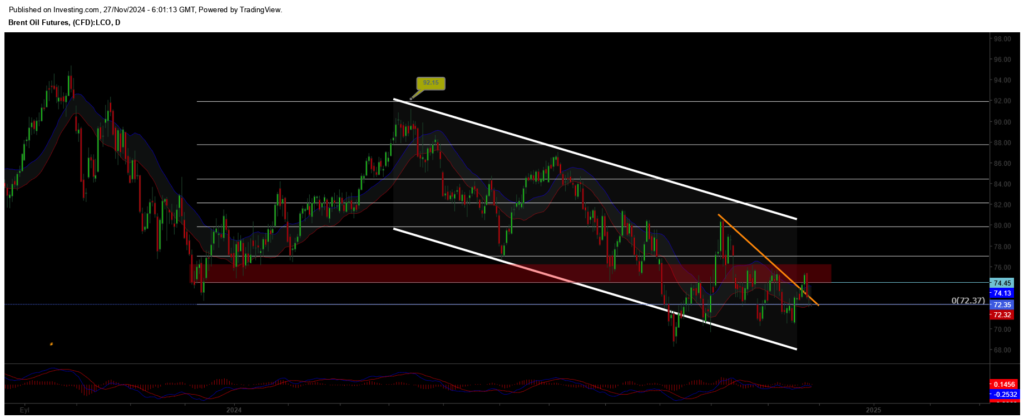
Brent crude has shown medium-term recovery and regained its previous channel structure, continuing its upward trend. It has surpassed the 76.98 resistance zone, and as long as it holds above this level, it is expected to rise towards the 80.00 – 82.00 range. In the event of a pullback, the critical support level to monitor is the 72.37 zone, where buyers are expected to become active. Maintaining this support is crucial for the continuation of the trend.
Resistances: 74.45 / 76.98 / 79.84
Supports: 72.37 / 71.00 / 70.50
EURUSD
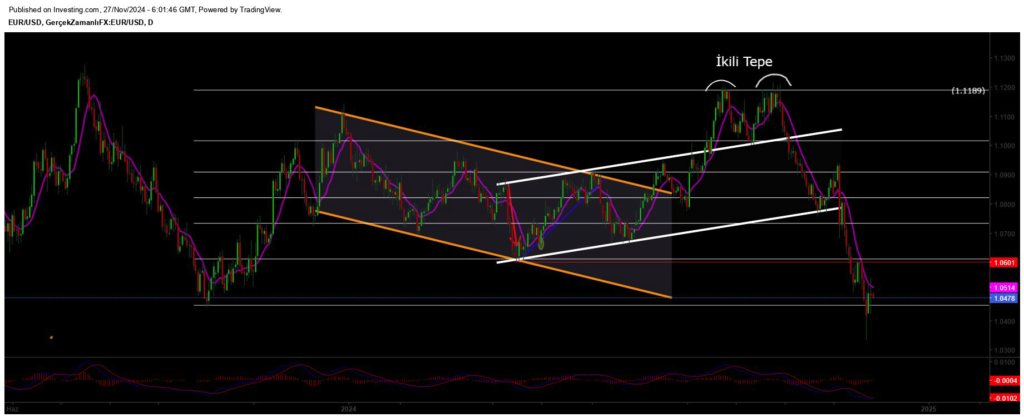
EUR/USD successfully broke through its ascending channel resistance and has been trading above both horizontal and channel resistance. It held above the 1.0983 resistance zone and reached our target of 1.114. However, facing selling pressure around 1.11, it lost this zone, creating a “deviation” and leading to a pullback. Now, the critical support level to watch for EUR/USD is 1.0983. Maintaining this level is crucial for stabilizing the price.
Resistances: 1.114 / 1.130 / 1.135
Supports: 1.098 / 1.088 / 1.080
XAUUSD
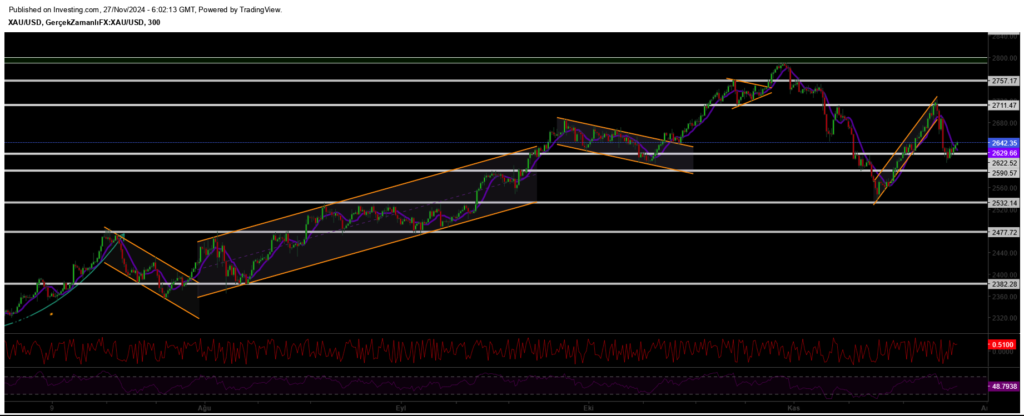
Gold has successfully rebounded from the 2533 level, reaching the anticipated target. However, it faced strong selling pressure from the rising channel resistance and horizontal resistance zone. It is currently trading actively at the 2668 level. Further pullbacks seem likely in the near term. In this context, the 2652 level emerges as a key support to monitor closely.
Resistance Levels: 2711 / 2757 / 2800
Support Levels: 2622 / 2590 / 2530


Leave A Comment